
We live in an uncertain world. Unfortunately for investors, too much uncertainty gives the market a terrible case of heartburn. Even though the market has posted a healthy start to the year, apprehension remains.
Three Top Contributors to Current Market Jitters:
- Signs of slowing economic growth around the world
- Uneasiness about tariffs and ongoing trade disputes
- Concerns about the Federal Reserve’s and other central banks’ responses to a global slowdown
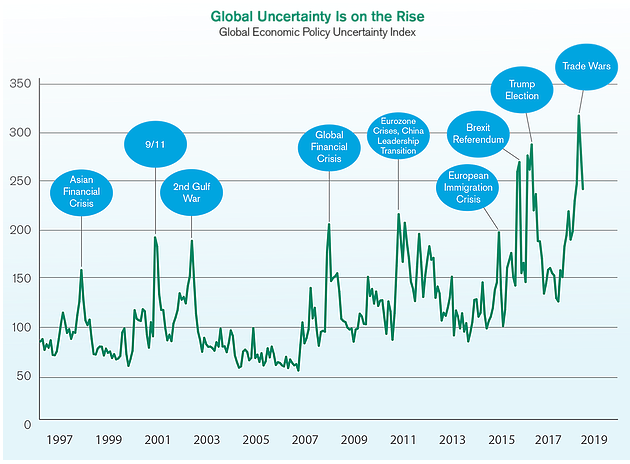
One way to diagnose the degree of uncertainty is with the Global Economic Policy Uncertainty (GEPU) Index. It looks at the frequency of reporting on uncertainty in 20 countries.
Greater clarity on trade, interest rates and economic growth would soothe market pain, but appears unlikely in the near term. However, you can take steps to combat the effects of a downturn on your portfolio.
Chicken Soup for the Portfolio; Diversification
Chicken soup is an age old home cure for the common cold, now with plenty of evidence to back it up. Similarly, diversification is a known treatment to help manage portfolio ills caused by uncertainty. Take for example the “dot-com crash” in 2002, when technology stocks plummeted after enjoying a huge run-up in prices. The magnitude of declines and ensuing recovery times were remarkably different depending on the degree of diversification and risk. 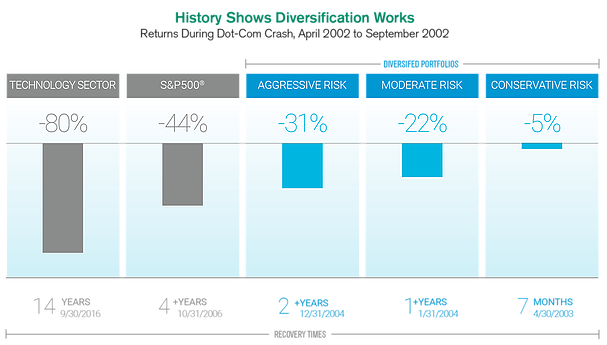 Portfolios with more exposures to other sectors and asset types still declined, but recovered from losses much sooner.
****
The Global EPU Index is a GDP-weighted average of national EPU indices for 20 countries. Each national EPU index reflects the relative frequency of a country’s newspaper articles that contain a trio of terms pertaining to the economy (E), policy (P), and uncertainty (U). Data from 1/1/1997 to 2/1/2019. Source: "Measuring Economic Policy Uncertainty" by Scott R. Baker, Nicholas Bloom and Steven J. Davis at www.PolicyUncertainty.com.
Source: Morningstar. Technology sector represented by the S&P 500 Information Technology Index. Diversified portfolios are represented by Morningstar category averages as follows: Aggressive Risk – Allocation 70% to 85% Equity; Moderate Risk – Allocation 50% to 75% Equity; Conservative Risk – Allocation 30% to 50% Equity.
Investment return and principal value of security investments will fluctuate. The value at the time of redemption may be more or less than the original cost. Past performance is no guarantee of future results.